Semaglutide side effects: counting people, events and time in STEP
Different counting units answer different questions about repeated symptoms and the population being observed.
AI-assisted editorial analysis of public research. This article has not received independent human medical review. It does not evaluate a provider’s clinical care.
Imagine an event register with six rows. Those rows could describe six different people, two people with three episodes each, or one person with six episodes. The register has the same length in every case, but the number of people affected differs. A count acquires its meaning from the rule used to create a row. Reading a safety table therefore starts with the counted object, before comparing the size of its numbers.
Three questions organize that reading: what is counted, which observations qualify, and what denominator belongs underneath? Changing any one changes the quantity being described. The examples below are deliberately hypothetical arithmetic exercises, not reconstructed patient histories. They show how apparently similar summaries can preserve different information. The vocabulary in our guide to medication name, dose and concentration provides another instance of this principle: a number without its unit leaves the measurement incomplete.
Interpretation at a glance
- Counted object. An episode total and a count of unique people preserve different information. [1]
- Shared membership. Adding category counts requires knowing whether the same person belongs to several categories. [1]
- Observation time. A rate has a time denominator; a proportion has a defined population denominator. [1]
- Weighting. Different weights can produce different summaries from the same underlying stratum values. [1]
- Distribution. An overall average does not identify how observations are spread among individuals. [1]
What the noun after a number tells you
A person-level indicator answers a yes-or-no question for each eligible person. Once that indicator becomes positive, another episode does not create another person. An episode counter does something different: every qualifying record adds to its total. These two operations can be applied to the same underlying information without producing interchangeable answers. GI is an abbreviation for gastrointestinal; it describes the category of experience, not the statistical unit.
Consider an imaginary register containing records A1, A2, B1 and C1, where the letter identifies a person. Counting rows gives four. Counting distinct letters gives three. Dividing the first count by the second gives a mean number of recorded events among those represented in the register. It does not give the proportion of an enrolled population affected, because the register says nothing about people with no event record. That calculation needs another list.
The distinction also affects data cleaning. Removing an accidental duplicate record can improve an episode total, while combining two genuinely separate episodes would change the outcome definition. Deduplicating by person is appropriate when constructing an ever-affected indicator, but would deliberately erase recurrence information. The right operation follows the question. A table heading should make clear which operation has already occurred before the reader starts doing arithmetic.
Where the study counts come from
In STEP 1–3’s weekly subcutaneous semaglutide safety pool, 1,562 of 2,116 people reported 6,993 GI events. On-treatment meant a dose within 49 days. Percentages and exposure rates were trial-adjusted. Novo Nordisk funded the trials.
An observation rule is a boundary around an analysis, not a description of everything that could have happened. In an invented study, an event might be recorded in the database yet fall outside a chosen exposure window. Keeping that record for one question and excluding it from another need not be a contradiction. The questions can differ in whether they concern a treatment period, all follow-up, or a particular interval after an exposure.
Likewise, a randomized roster and a safety-analysis roster are distinct concepts. Random allocation describes how assignments were made. An analysis population describes which records qualify for a calculation. In a hypothetical protocol, those rosters might coincide, or an explicitly stated eligibility rule might make them differ. Neither the label randomized nor the label safety supplies that rule by itself. A count should retain the population definition that generated it.
This is also why a research denominator cannot settle whether an individual meets clinical criteria. Statistical membership and a personal assessment answer different questions. Our eligibility guide belongs to that separate discussion; it is not a substitute denominator for a trial table.
Reading a count chart without inventing a denominator
The figure below presents selected event counts. To interpret any such chart, first inspect the unit on the axis and the scope of its categories. A bar can show the size of a recorded total without specifying how many unique people contributed to it. Its visual precision does not fill in the omitted person-level information. The labels and accompanying table are part of the measurement, not optional decoration.
For an invented example, suppose a chart includes two categories with forty and twenty records. The taller bar has twice as many records. That statement alone does not mean twice as many people were affected: repeated episodes could be distributed differently between categories. It also does not establish a twofold event rate if the relevant observation time differs. Each additional conclusion requires a denominator or linkage information that the two bars do not contain.
A selected-category chart is not necessarily an exhaustive partition. Adding its bars produces the sum of the displayed counts, and only that sum. To call the result a total across all possible categories, one would need an explicit statement that the categories are complete and mutually exclusive at the unit being counted. The existence of a common axis does not provide either property. Zero is a useful count origin; it does not turn the display into a complete inventory.
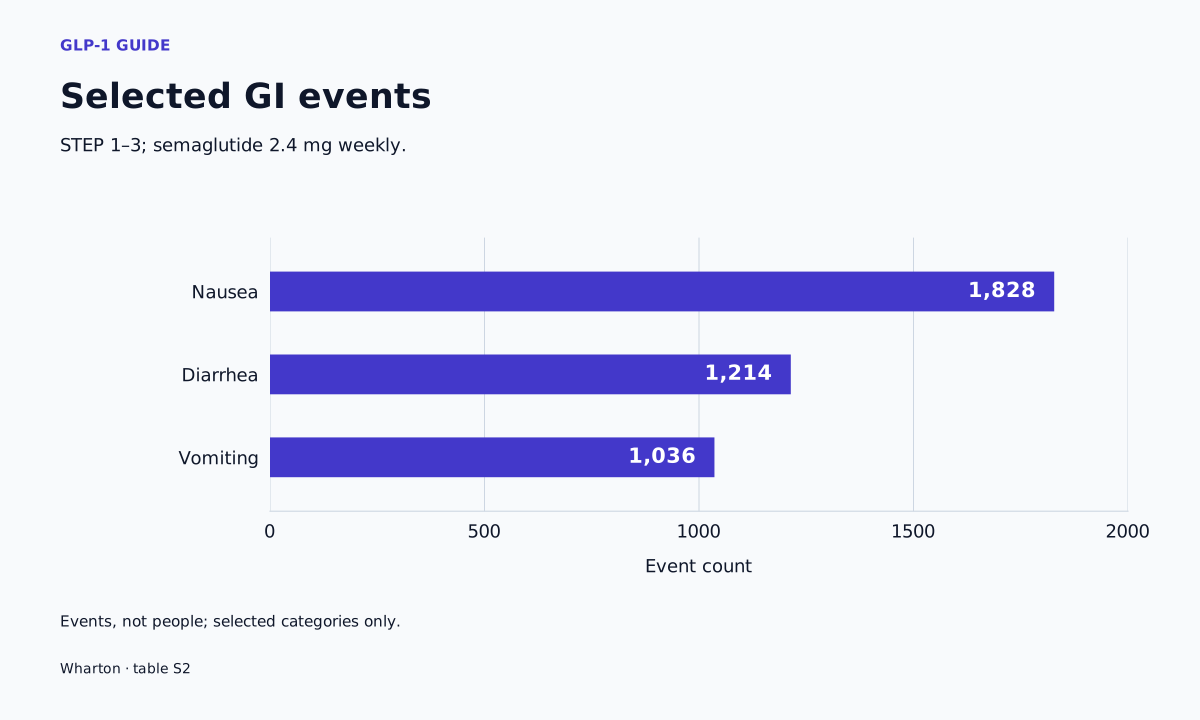
STEP 1–3; semaglutide 2.4 mg weekly.
| Event | Count |
|---|---|
| Nausea | 1828 |
| Diarrhea | 1214 |
| Vomiting | 1036 |
Repeated episodes and the distribution behind a mean
Suppose three imaginary people contribute six events. One possible distribution is two, two and two. Another is four, one and one. Both produce a mean of two events per affected person, but the second distribution concentrates more of the burden in one person. Neither distribution can be recovered from the total and the number affected alone. An average compresses the data; it does not preserve the original arrangement.
The denominator changes again if a fourth person with no events is included. The event total stays fixed, while the mean across all four becomes smaller than the mean among the three affected people. Both averages can be calculated correctly, yet they describe different populations. Reporting only the phrase events per person leaves unresolved whether people with zero counts were included. That unresolved choice matters even before considering any treatment comparison.
The conceptual table distinguishes several ways to summarize a register. These are choices about what information to retain, not claims about how a particular trial database was organized. A person-linked event file can support several summaries; an aggregated total usually cannot reconstruct the links after they have been discarded. Retaining identifiers permits questions about concentration and recurrence that a category total cannot answer.
Recurrence also raises a question about independent information. In a hypothetical model where episodes within one person tend to occur together, treating every episode as an unrelated person would misrepresent the structure. The event total alone cannot tell an analyst how much independent information is available for an uncertainty calculation. Person linkage permits that dependence to be considered; a list of anonymous category totals does not reveal it.
| Record unit | How it is counted | What gets lost |
|---|---|---|
| Person | Once after an event indicator becomes positive | Repeat frequency and timing |
| Episode | Once per recorded event | Which events belong to the same person |
| Category flag | Once per person within a category | Overlap between categories |
Overlapping symptoms and the arithmetic of either
Imagine one hundred people observed under a shared rule. Fifteen have symptom A, twelve have symptom B, and five have both. Adding the separate counts gives twenty-seven, but that addition counts the five shared people twice. The number with either symptom is twenty-two: add the two sets, then subtract their intersection once. This is a statement about unique people, not a claim that their episodes occurred at the same moment.
If the overlap were unknown, the separate totals would not identify the combined number. In this imaginary population, the combined count could range from fifteen, when everyone with B also has A, to twenty-seven, when nobody has both. Knowing only the margins leaves a range of possible joint arrangements. A complete joint table would separate A only, B only, both and neither, making the overlap directly visible.
Categories can be exclusive for one unit and overlapping for another. An individual event record might receive a single category, while one person contributes different records in different categories. Exclusivity of record codes therefore does not establish exclusivity of people. Our companion article on dose-specific averages in SURMOUNT-1 examines a different selection problem: how the identity of a comparison changes when observations are grouped.
Time supplies a denominator of its own
Ten events accumulated during twenty person-years give an event rate of one-half event per person-year. This hypothetical rate has a time unit. It is not a fifty-percent probability, and it does not reveal how many people experienced any event. Recurrent episodes can contribute repeatedly to an event numerator, whereas the proportion ever affected counts each eligible person at most once within its defined observation period.
Person-time combines the eligible durations contributed by individuals. Ten people each contributing two years and twenty people each contributing one year both produce twenty person-years. The total duration matches, but the opportunities to observe long individual histories differ. A question about recurrence within a person might therefore require more than the pooled exposure total. The aggregate denominator does not retain each person's sequence or explain why their observation period ended.
A rate-to-probability conversion needs a model for how events arise over time and clarity about whether the outcome is a first event or repeated events. Simply attaching a percent sign to a rate changes its meaning without supplying that model. Observation windows also matter: shifting a boundary can move a record into or out of the numerator. An interpretable rate pairs a precisely defined event with the eligible time during which that event could count. These are mathematical requirements, not instructions for choosing an individual's treatment window.
A pooled fraction and an adjusted summary can differ
Consider two hypothetical strata. In the first, ten of twenty people have an outcome; in the second, ten of eighty do. The separate proportions are one-half and one-eighth. Combining their raw counts gives twenty out of one hundred, or one-fifth. That pooled fraction gives more influence to the larger stratum because it contributes more people. The influence arises from the sample sizes, even without an explicit weighting step.
Now give the two stratum proportions equal weight. Their average is five-sixteenths, or 31.25 percent. This differs from the raw pooled proportion even though every underlying observation remains unchanged. The calculation has changed the population mix represented by the summary. Equal weighting is not automatically better; it answers a different aggregation question. A choice of weights needs a reason tied to the intended target, rather than a preference for whichever answer looks more favorable.
This example explains why reconstructing an adjusted result by dividing two printed totals can fail. The raw totals may not retain the weighting information needed for the adjusted quantity. Before declaring an inconsistency, identify whether both numbers describe the same target and use the same aggregation rule. Conversely, an adjustment label does not make an estimate universally applicable: its interpretation still depends on the variables, weights and assumptions used to construct it.
Weighting makes no difference when every stratum has the same proportion: any weighted average using nonnegative weights that sum to one then equals that common value. Different answers become possible when the stratum values differ. This provides a useful diagnostic question. Is the disagreement about the observations within groups, or about how much influence each group receives? Those disagreements require different investigations.
What additional records would answer the next question
A total constrains the possibilities without selecting one complete history. If ten affected people contribute thirty events, every affected person must contribute at least one under that definition, but the remaining events can be distributed in many ways. A histogram of person-level counts would distinguish some of those possibilities. Dates would add another dimension, showing whether repeated episodes were close together or separated over the observation period.
Even linked counts do not automatically describe duration. Two event registers can have identical episode totals while the recorded episodes last very different lengths of time. A duration question requires start and end information, together with a rule for handling episodes that remain unresolved at the boundary. Similarly, a severity question requires severity measurements. Neither property can be inferred merely because the count is large or small.
The table below maps questions to the information they require. This helps specify what remains unidentified instead of treating every uncertainty as the same missing detail. A request for more data becomes more useful when it names the needed linkage, timing or denominator. The same discipline applies when using a semaglutide and tirzepatide comparison: first identify which outcome is actually being compared.
A zero deserves its own definition as well. In a hypothetical register, zero recorded episodes after complete observation differs from an empty field caused by unavailable observation. Treating both as confirmed absence would erase that distinction. The data dictionary and observation record are needed to decide which interpretation a field supports.
| Question | Required information | Insufficient substitute |
|---|---|---|
| How concentrated are repeat events? | Person-linked event counts | The overall event total |
| How quickly do events accumulate? | Dates and eligible observation time | A count without a time denominator |
| How many people had either symptom? | Joint symptom indicators | The sum of separate percentages |
The population and product belong with the estimate
A hypothetical population containing mostly short observation periods can yield a different ever-affected proportion from one followed much longer, even if other features are held fixed in the thought experiment. Transporting an estimate therefore requires attention to more than its arithmetic. The people, observation opportunity and intervention definition are parts of the target question. Matching one feature does not establish that every other relevant feature matches.
Product identity raises the same logical issue. An estimate attached to one specified intervention does not become evidence for every intervention sharing a word in its name. Our guide to brand-name and compounded products addresses that distinction. FDA does not approve compounded GLP-1 drugs or review their safety, effectiveness and quality before marketing.
Provider documentation is another type of evidence with another unit of analysis. A service description concerns terms or processes; a participant-level outcome concerns people under a defined study rule. A reader examining our Ro review should check its dated documentation on its own terms. Linking the documents does not supply the missing study population, observation window or outcome measurements that would be needed to evaluate that service's clinical results. The evidentiary connection must be demonstrated, not assumed from proximity.
A population summary cannot classify an individual episode
Current Wegovy prescribing information describes potentially severe gastrointestinal reactions, kidney injury associated with volume depletion and delayed gastric emptying. Wegovy is not recommended in severe gastroparesis. The label advises contacting the healthcare provider for severe or persistent gastrointestinal symptoms. These warnings concern clinical assessment, not a probability calculated from an event chart.
The statistical distinction is between a distribution and a classification rule. A population summary can describe how observations accumulate under its definitions. To classify a new individual's experience, one would need information relevant to that person and a justified decision rule. The overall frequency alone does not supply the cause, severity or consequences of the particular episode. Our side-effect management guide is separate reading; this analysis does not prescribe a response or a dosing change.
A hypothetical screening example shows why the distinction matters. Even when a feature is common in a population, its presence need not identify one explanation: several explanations may produce the same feature. Resolving that question requires information about how the feature behaves under the competing explanations, not just its overall prevalence. Counts, rates and averages are valuable precisely when their scope is preserved. Asking them to make a personal determination adds a new inferential task that the descriptive arithmetic has not performed.
Questions
Can one person contribute several events?
Yes, under an episode-counting rule. A separate person-level indicator records whether that individual had at least one qualifying episode. The two summaries can coexist because one retains recurrence and the other collapses it. To move between them, an analyst needs person-linked records; an aggregate event total does not restore those links. [1]
Do separate symptom percentages add to an overall risk?
Only when the relevant categories are mutually exclusive for the people and observation period being counted. Otherwise shared membership must be accounted for. Knowing the individual category percentages without their overlap can identify several possible combined percentages rather than a unique answer. A joint table distinguishes those possibilities. [1]
Why can an adjusted percentage differ from a raw fraction?
The calculations may assign different weights to the same underlying groups. A raw pooled fraction weights groups through their sample sizes, whereas another summary may represent a different population mix. Comparing the results requires identifying both weighting rules and targets. Different arithmetic targets should not be treated as interchangeable estimates. [1]
Does an event rate tell me the chance of an event?
A rate counts events relative to eligible time. A probability describes the chance of a specified outcome over a specified horizon. Connecting them requires additional assumptions about event timing and whether repeat events count. The units alone reveal why a rate cannot be read directly as a percentage of people. [1]
What would show whether repeated events clustered in a few people?
A distribution of person-linked episode counts would reveal concentration that an overall total hides. Dates and durations would then distinguish timing and persistence. Those are separate dimensions: a high episode count does not, by itself, establish a long continuous episode or a particular level of severity. [1]
Editorial assessment
An informative safety summary keeps its arithmetic attached to a defined observation system. Start with the unit, then identify the eligible population or time denominator, and only then interpret the magnitude. If a question concerns recurrence, preserve person linkage; if it concerns either of two symptoms, preserve their overlap; if it concerns accumulation over time, preserve exposure duration. Weighting introduces a further choice about the population being represented. These distinctions explain which conclusions follow from a table and which require additional records or assumptions. They also make uncertainty specific: the missing information has a name and a reason it matters.
Evidence limits
The worked examples are hypothetical and do not reconstruct individual records. Aggregate summaries do not identify every joint distribution, timing pattern or personal outcome. This interpretation does not establish clinical equivalence between products or validate a provider's care.
Sources
See our affiliate disclosure for commercial relationships.