Tirzepatide in SURMOUNT-1: what dose-specific averages describe
Dose assignment, later symptom grouping and a modeled endpoint each determine what a comparison means.
AI-assisted editorial analysis of public research. This article has not received independent human medical review. It does not evaluate a provider’s clinical care.
A treatment result is a number attached to a question. Imagine two analysts using the same collection of measurements. One averages every final observation available after treatment starts. The other first selects people meeting a later condition, then estimates an outcome within that selection. Their answers may differ even though neither analyst changed a recorded weight. The operation performed on the records determines the meaning of the result. Reading the dose beside a number is therefore only the beginning: the population, selection rule and calculation belong to its identity too.
Change one ingredient in thought while holding the others fixed. Would the question stay the same with an earlier observation, different contributors, or an outcome expressed in kilograms rather than percentages? Each alteration tests a different assumption. The deliberately invented examples below make those operations visible. They demonstrate statistical reasoning, not reconstructed participants or predicted treatment responses. Keeping that distinction clear allows examination of an estimate without pretending to know the individual records behind it.
Interpretation at a glance
- Define the target. Specify the people, intervention, outcome, time and treatment-change rule before interpreting a number. [2]
- Track selection. A condition applied after allocation can alter which records contribute to a comparison. [2]
- Keep the denominator. An average of individual percent changes and a percent change in total weight answer different questions. [2]
- Separate two uncertainties. Uncertainty about an estimated average differs from variation among individual outcomes. [2]
- Read a curve cautiously. A few ordered points do not determine the shape between them or identify a personal optimum. [2]
A dose label is only one part of an estimate
Consider an estimate as a sentence with several necessary blanks: an outcome, in a population, under an intervention, at a time, with a rule for later treatment changes. Filling only the intervention blank leaves many possible questions. Even a precisely written drug amount cannot tell us which measurements entered the calculation or which future circumstances the answer is supposed to represent.
An estimand is the target of that calculation. The term separates the question researchers want answered from the particular method used to estimate it. Two methods can aim at the same target, while the same mathematical operation can be applied to different targets. Calling both outputs averages does not establish that they describe comparable groups or periods of observation.
Suppose an imaginary dataset contains both one record per person and several visit records per person. Averaging its rows without examining their meaning could give frequent visitors more influence. Identifying the record unit precedes choosing a formula. Our companion discussion of people, events and time examines a related counting problem without transferring results between medicines.
Check whether the labels needed to reconstruct the target accompany the number. Medication name, dose and concentration address another part of this vocabulary. Matching one label is insufficient when another changes: a result attached to a particular observation rule remains attached to that rule even when its numerical value looks familiar.
Allocation and later selection are different operations
SURMOUNT-1 randomized weekly subcutaneous tirzepatide doses; one reported nausea, vomiting or diarrhea event defined symptom grouping. The efficacy analysis excluded post-discontinuation measurements and used repeated-measures modeling. Lilly funded the study.
To see why timing matters, imagine a randomized comparison in which an unmeasured personal characteristic influences both a later experience and the final outcome. Suppose the intervention also influences that experience. Keeping only people with one experience status can then leave different mixtures of the personal characteristic in the assigned groups. The selection rule creates a new comparison inside the original one; this is a logical possibility, not a claim that a particular characteristic caused these results.
Random allocation concerns the groups before that later restriction. It does not require every subset formed afterward to preserve their original comparability. A useful paper exercise is to draw two arrows into the selection condition, one from assignment and one from the personal characteristic. Conditioning on their shared consequence can link assignment with the characteristic among the retained records, even if assignment originally had no such relationship.
This reasoning identifies what additional justification a causal interpretation would need. It does not prove selection distorted an estimate or establish the direction or size of any distortion. Those are separate empirical questions. A descriptive comparison within selected records differs from a contrast attributable to changing the intervention under defensible assumptions.
Three points within one selected subgroup
A negative percentage on a weight-change axis indicates movement below the reference weight. The direction of a bar and the magnitude of its value have separate jobs: the sign gives direction, while distance from zero gives size. In a purely illustrative plot, minus twelve percent represents a larger proportional reduction than minus eight percent, although the signed number is smaller. Describing a bar as higher without naming the axis can therefore obscure the intended comparison.
An estimate of a mean is also different from a collection of individual outcomes. Consider two invented groups with reductions of six and fourteen units in one group, and ten and ten in the other. Both average ten, but only the second has no spread in these two observations. Equal averages do not imply equal distributions; different averages do not reveal how much the distributions overlap. A plotted summary cannot supply the missing distribution by itself.
The same distinction applies when a calculation uses a statistical model. The displayed point is an answer produced under the model and its target, rather than a substitute for every record. Reading a chart consequently involves three separate checks: what the vertical categories identify, what the horizontal measurement means, and which uncertainties or distributions have not been displayed. The accessible table preserves the plotted values; it does not add those missing dimensions.
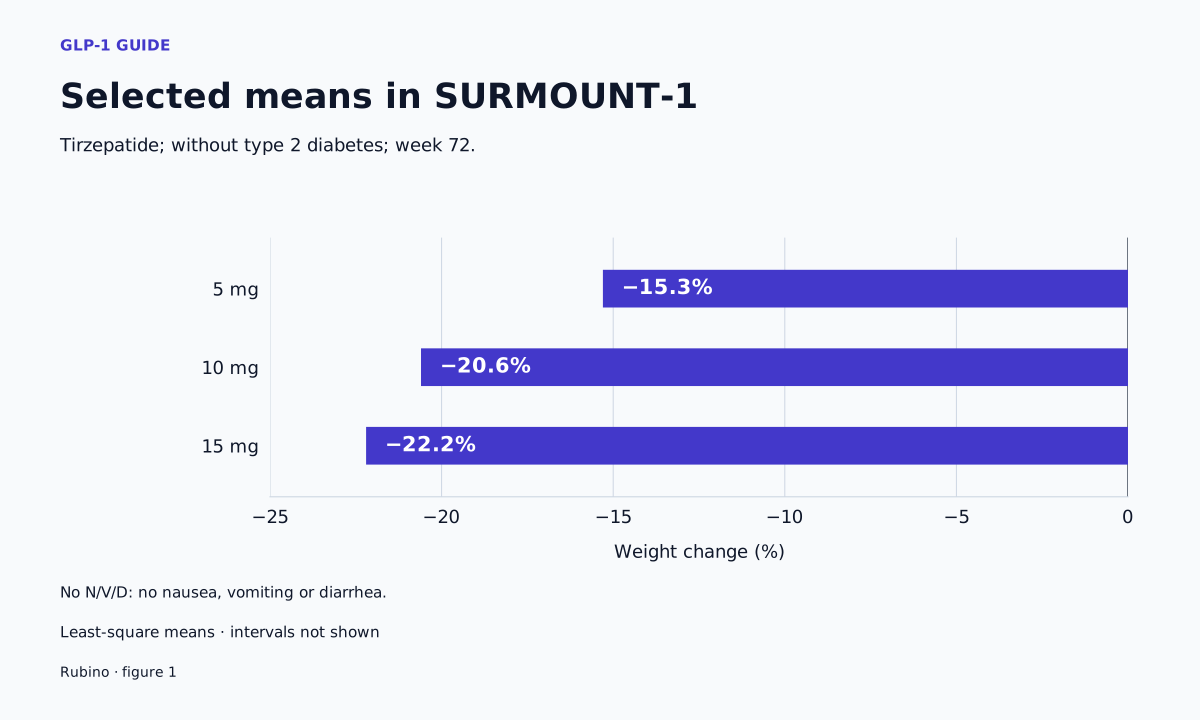
Tirzepatide; without type 2 diabetes; week 72.
| Dose (mg) | Weight change (%) |
|---|---|
| 5 | -15.3 |
| 10 | -20.6 |
| 15 | -22.2 |
Percent change keeps a baseline in its denominator
Percent change divides the difference between a later value and a starting value by that starting value. For a hypothetical person starting at eighty kilograms, an eight-kilogram reduction is ten percent. For another starting at one hundred twenty kilograms, a twelve-kilogram reduction is also ten percent. The proportional changes agree while the absolute changes differ. No treatment assumption is needed for this arithmetic, and these invented starting weights are not estimates for trial participants.
Now use a different imaginary pair: one person goes from sixty to fifty-four kilograms and another from one hundred twenty to ninety-six. Their individual changes are minus ten and minus twenty percent. Giving each person equal weight produces an average change of minus fifteen percent. Combining their weights first produces a decline from one hundred eighty to one hundred fifty kilograms, approximately minus sixteen-point-seven percent.
The discrepancy is not an arithmetic mistake. The combined-weight calculation gives greater influence to the person with the larger starting weight, whereas the average of percentages gives each person equal influence. These operations happen to coincide in some datasets, but coincidence would not make their definitions interchangeable. Before translating a summary into another unit, identify exactly which operation generated the published quantity.
A personal kilogram forecast adds another assumption: that a group summary applies to one individual. Multiplication cannot justify that assumption; it simply changes the unit. Distinguishing a conversion from a prediction remains necessary even when the arithmetic is accurate.
Modeling answers a question under assumptions
Imagine repeated measurements scheduled at an early, middle and final visit. Some hypothetical participants have all three measurements, while others lack the final one. A mean calculated from available final measurements uses one particular subset. A model using the repeated observations can ask how outcomes vary across visits and participant characteristics. Whether that helps answer the desired final-visit question depends on the model and on assumptions about the incomplete records.
For example, an analyst could estimate an outcome at a common combination of characteristics rather than average the observed mixture in each group. That operation answers a standardized question. It can make comparisons more interpretable when the chosen standard is relevant, but it does not turn the standardized person into an actual participant. Nor does it establish that every important difference was measured or represented correctly.
Measurements from one person share a history. Treating visits as entirely independent people can misrepresent the information present. In an extreme hypothetical example, copying one measurement into ten rows adds no observation. Real repeated measurements are not mere copies, but the example shows why row count alone cannot determine precision.
Unobserved outcomes introduce another limitation. A model may predict them under specified assumptions, yet a prediction is not a recovered measurement. A sensitivity analysis changes a relevant assumption and examines how the answer moves. Agreement across plausible alternatives can be informative; disagreement identifies dependence on the assumptions. Neither exercise licenses inventing a missing outcome, a covariance structure or an uncertainty interval that the report has not supplied.
The question after treatment changes
An imaginary participant starts an intervention, changes treatment before the planned endpoint and later has another measurement. A question about the course after starting might need that later measurement. A question restricted to continued exposure could handle it differently. Both questions can be meaningful, but they refer to different experiences. The term estimand helps make this choice explicit before an analyst decides which records to include.
Removing a later record from one calculation does not reveal whether it was collected, retained elsewhere or relevant to another endpoint. Data collection and analysis eligibility are separate operations. Think of a ledger containing a date, measurement and exposure status: an analyst can filter the ledger without erasing its other rows. Conversely, deciding to include a type of observation cannot make it appear if the measurement was never obtained.
An observed-record summary adds a third possibility. It may accurately describe the records available under a stated rule while leaving a broader target unresolved. The next step is to identify the gap: missing measurements, a different exposure history, or a population excluded by the rule. Combining these possibilities under one vague idea of follow-up can hide which assumption would actually be required to connect the available summary to the desired question.
| Target question | Records it would require | Interpretive limit |
|---|---|---|
| Course after starting | Follow-up through later treatment changes | Selected exposure records cannot supply every later outcome |
| Outcome during continued exposure | An explicit exposure and visit rule | The rule can select a different set of observations |
| Observed record summary | A defined set of available measurements | Availability alone does not identify a causal effect |
Keeping a population attached to a dose
A result can change when the mixture of people changes, even if every subgroup retains the same outcome. In an explicitly invented example, subgroup A has an outcome of five units and subgroup B has fifteen. A population composed of ninety percent A and ten percent B averages six. Reversing the mixture produces fourteen. Nothing within either subgroup changed; the weighting changed the population-level answer.
Transportability asks whether an inference can be carried into a different population and under what assumptions. The example shows one reason a matching drug name cannot settle that question. Relevant characteristics could have a different distribution, or the relationship between a characteristic and an outcome could itself differ. Neither possibility can be quantified simply by comparing two headline averages from different settings.
A stronger comparison begins by identifying the target population, the features that could modify the outcome, and whether the available data cover the combinations present in that target. A weighted estimate cannot supply information about a type of person wholly absent from the data without additional assumptions. Our semaglutide and tirzepatide guide provides medicine-specific context; numerical comparisons still require compatible questions.
Individual clinical eligibility is a distinct question. Resembling a study population on one characteristic does not settle treatment suitability, and a population mean does not resolve personal assessment. Read the eligibility guide with that distinction in mind. Identify the population an estimate describes before considering how much of that description carries elsewhere.
A trend is not a complete dose-response curve
Imagine three measurements taken at three positions on an abstract horizontal axis. A straight line, a bent line and a smooth curve can all pass through the same points while behaving differently between them. If the positions are the only observations available, choosing one connecting shape adds an assumption. An orderly sequence of points does not itself determine whether change between them is linear, abrupt or nearly flat over part of the interval.
Interpolation concerns positions within the observed range; extrapolation reaches beyond it. Both require a relationship between position and outcome, but extrapolation asks that relationship to hold where no point anchors it. In a hypothetical curve that gradually levels off, extending an earlier straight segment would overstate later change. A curve that steepens would create the opposite error. These examples show why a plotting choice cannot establish the underlying biological shape.
A personal optimum would require still more information: relevant benefits, harms, uncertainty, constraints and individual priorities. Maximizing one plotted outcome is a mathematical rule, not a complete treatment decision. Even an accurately estimated population curve would not automatically identify the preferred intervention for every person. The scientific task here is to separate the evidence for an ordering from the assumptions required to turn that ordering into a continuous curve or an individual choice.
Precision and clinical meaning need separate evidence
Suppose two invented estimates differ by two units. That subtraction tells us their numerical separation, but not whether the contrast is estimated precisely. Precision depends on the information in the data and the estimation procedure. If the two estimates share observations or modeling components, their uncertainties may be related. Treating them as independent without justification could misstate the uncertainty around their difference.
An uncertainty interval for an average and an interval describing individual outcomes answer different questions. The average can become more precisely estimated as information accumulates while individual responses remain widely dispersed. A narrow interval around a mean therefore does not imply that nearly everyone experiences a value close to that mean. To assess personal variability, information about the distribution is needed.
Clinical importance adds a judgment about the size and consequences of an outcome difference. A threshold should have a defensible meaning for the relevant population and question; it cannot be selected afterward merely because it makes the observed result sound impressive. Statistical evidence of a difference does not establish that it matters enough to change a decision, and an imprecise result does not establish equivalence.
Equivalence requires a suitable margin and an analysis assessing whether a contrast falls within it. Failing to detect a difference is different: the data might be insufficiently informative. Ordering, precision and importance each need their own support, even when bars are easy to rank by eye.
| Claim | Evidence required | What an ordered plot omits |
|---|---|---|
| Numerical ordering | Clearly labeled point estimates | Uncertainty around each estimate |
| A reliable contrast | A valid comparison and uncertainty analysis | Subgroup comparability and estimation error |
| A meaningful clinical difference | A justified outcome threshold and relevant population | Individual variation and personal treatment priorities |
Carry the evidence identity into the next question
Current Zepbound labeling describes potentially severe gastrointestinal reactions, kidney injury associated with volume depletion and delayed gastric emptying. It does not recommend use in severe gastroparesis and advises contacting a healthcare provider for severe or persistent gastrointestinal symptoms. These warnings provide safety context for clinical assessment, not a probability calculated from a weight-change plot.
FDA says compounded GLP-1 drugs lack approval and its premarket review of safety, effectiveness and quality.
The logical issue in changing products is whether the intervention in the original question has been preserved. A shared ingredient name alone does not prove that formulation, route, exposure or other relevant conditions match. Our brand-name and compounded guide provides context for examining that distinction. The separate side-effect guide concerns symptom questions that a statistical average cannot resolve.
A service comparison changes the object of evaluation again. Documentary terms, a medication estimate and an individual care outcome are different kinds of evidence. The CoreAge Rx review is a place to examine dated service information, without treating a study result as validation of a provider. Keeping these questions separate prevents a numerical estimate from acquiring a claim about an institution or clinical encounter that its calculation never addressed.
Questions
Does random assignment justify every comparison made afterward?
No general rule guarantees that. A later selection condition can retain different mixtures of people from originally assigned groups. To interpret the selected comparison causally, examine why the selection would preserve comparability or how an analysis would address the differences it could introduce. The timing and purpose of the selection matter. [2]
Can the largest plotted change identify a personal optimum?
A numerical maximum answers which displayed value is largest under the chosen measurement. A personal optimum requires a decision rule incorporating relevant benefits, harms, uncertainty and circumstances. Those ingredients cannot be recovered from the ranking alone. Changing the outcome or the importance assigned to it could change the decision even with identical plotted values. [2]
Why is a modeled average different from one person’s result?
An average combines information to answer a group-level question, potentially after standardization or other modeling choices. A person contributes one history rather than the entire distribution. Two distributions can share an average while differing substantially in spread, so the summary alone does not establish how closely any individual outcome will resemble it. [2]
What is missing from a percentage-to-kilogram calculation?
The multiplication requires a starting weight, but accurate arithmetic is only one requirement. Applying a group percentage to an individual also assumes that the percentage is an appropriate personal prediction. That assumption needs evidence beyond the conversion. The result should otherwise be understood as a hypothetical illustration expressed in different units. [2]
What would support a continuous relationship between dose and outcome?
A specified model, relevant observations and checks of its assumptions would be needed. Several isolated points leave multiple possible shapes between and beyond them. Additional measurements can constrain those possibilities, while uncertainty and the comparability of the contributing groups determine how confidently the proposed relationship can be interpreted. [2]
Editorial assessment
Keep an estimate attached to its full question: intervention, population, outcome, time and treatment-change rule. Distinguish the operation that selected observations from the operation that summarized them. Only then does subtracting values or comparing positions on an axis have a clear interpretation. The original arithmetic examples show why changing a denominator, weighting scheme or selection rule can change an answer without changing any measurement. Preserving these distinctions makes an average more informative while keeping unsupported personal forecasts and causal claims outside its scope.
Evidence limits
This explanation examines measurement and inference, not individual treatment choices. Its invented numerical examples demonstrate mathematical distinctions and are not reconstructed participant data. A displayed summary cannot by itself recover individual trajectories, omitted records, a full outcome distribution or the assumptions needed for a different target question.
Sources
See our affiliate disclosure for commercial relationships.